

Mapganza
The legislature made their choice. The plaintiffs made theirs. Now the judge has all three maps and a decision to make.
Map C: for… Catastrophe? Corruption? Let’s Go With Both
On Monday, Utah’s legislature did what we all knew they would do: they picked Map C.
Of the 5 options proposed by the Legislature in the court-ordered redistricting process, they chose the one with a 6 out of 100 competitiveness score. The one that the Utah GOP literally sent an email in support of because it will “stop the Democrats.”
If you’re looking for subtlety in politics, you’re in the wrong state (and country but, here we are).
But we are only one step into this process. The legislature’s vote isn’t the end of the story. It’s actually just the beginning of the interesting part.
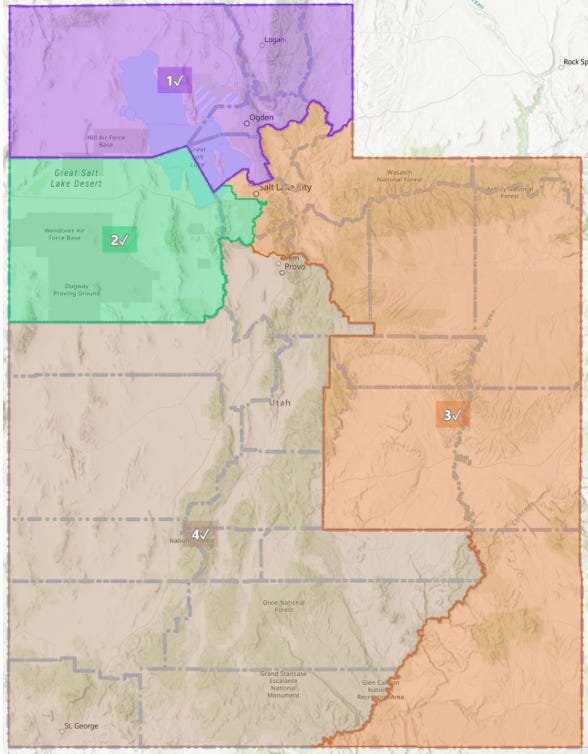
Because, as a part of this process, the plaintiffs in the legal case were invited to submit alternative maps to the court (just in case the legislature couldn’t follow the requirements of Prop 4). And so, the judge will be assessing three maps:
Map C (the legislature’s choice)
Plaintiff Map 1 (the algorithmic fairness map)
Plaintiff Map 2 (the “least change” competitive map)
And the judge gets the final choice.
So let’s talk about what each of these maps actually does, what the numbers say, and why this decision matters for every single Utahn who thinks their vote should count for something.
The Legislature’s Map: Totally Normal, Nothing Suspicious Here
Before we dive into Map C, let’s establish what we’re actually measuring here. Think of these as the standardized tests for redistricting, ways to objectively answer the question “is this map fair?” Thank you to Better Utah Institute for the detailed analysis of these maps. Read their whole report here.
The measures we will be assessing are:
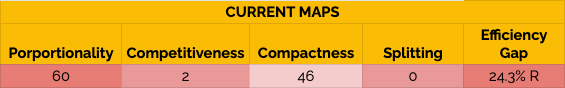
Proportionality – measures whether the seats a party wins actually match their share of voters statewide. If 60% of Utah voters pick Republicans, a proportional map would give them roughly 60% of the seats. Scores run from 0 to 100, with higher numbers meaning “yes, this map reflects how people actually vote.”
Competitiveness – tells you whether elections in these districts could actually go either way, or if the outcome is basically predetermined. Higher scores (0-100 scale) mean more districts where both parties have a legitimate shot at winning. Low scores mean you can call the race before anyone campaigns.
Compactness – is about geography—are districts sensibly shaped and contained, or are they stretched and contorted into weird configurations to capture specific voters? Higher scores mean cleaner boundaries. Lower scores often signal someone’s playing games with district lines.
Splitting – counts how many times a map unnecessarily chops up cities and counties across multiple districts. Lower numbers mean the map splits cities or counties more times unnecessarily. Higher numbers mean the map keeps communities together more often.
Efficiency Gap – is one of the smoking gun metrics for gerrymandering. It measures whether one party is systematically wasting more votes than the other through “packing” (cramming all their voters into a few districts) and “cracking” (spreading them thin across many districts). The bigger the gap, the more one party is getting screwed.
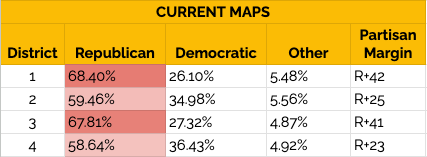
Partisan Margin – shows the expected winning percentage point spread in each district based on voting history. D+10 means Democrats are expected to win by 10 percentage points.
Got it? Good. Apparently, we are all map experts here now.
Here’s how our current maps square up, just so you can see the baseline in hell where we are starting.
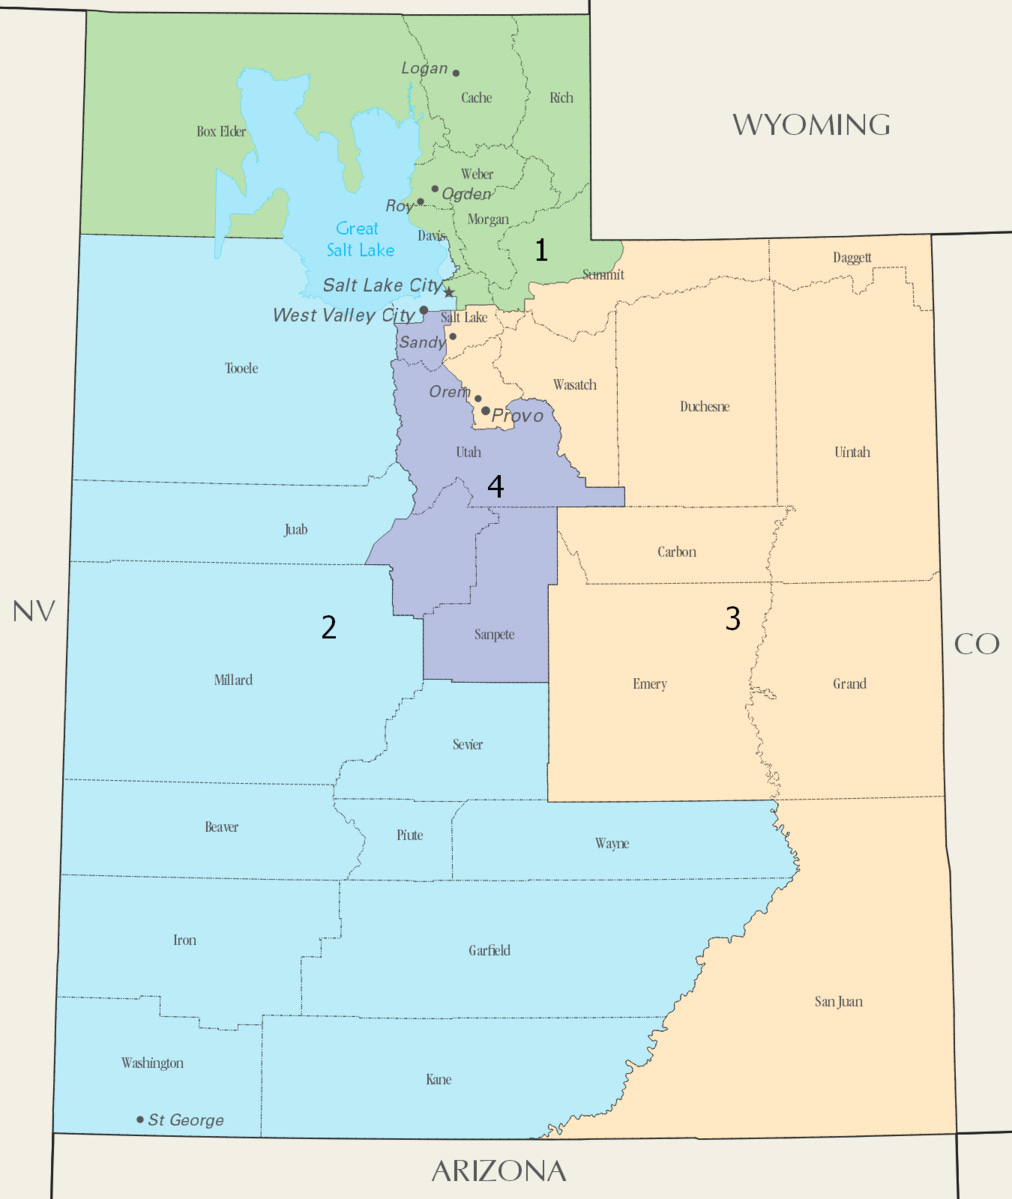
Now let’s see how Map C performs.
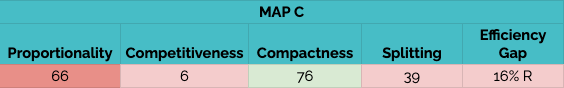
This map splits 3 municipalities into 11 pieces and 3 counties into 7 pieces. So while the Legislature spent the last month insisting they followed Prop 4 to the letter, turns out there are much better ways to do it. (See: the two plaintiff maps that don’t require a jigsaw puzzle to understand.)
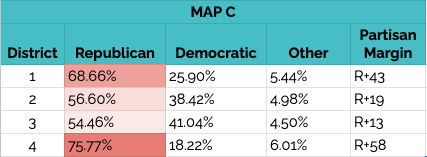
Every single district tilts heavily Republican. There are no swing districts. No straightforwardly competitive races. No districts where voters actually have a meaningful choice between candidates who might win.
Some reports have tried to salvage this by analyzing Trump’s 2024 performance in Utah—his worst showing among Republicans—to argue Map C could create two more competitive districts if Democrats run the table in a perfect storm election year. We’ll do a full breakdown of what it would actually take to flip one of these seats (spoiler: it’s a lot), but here’s the reality: if the legislature wanted to design a map that locks in their power for the next decade, they nailed it.
In a state where the GOP gets about 60% of the vote statewide, this map delivers 100% of the seats to Republicans. And that’s what I call representation.
The Plaintiffs’ Counterproposal: Just Make It Fair, Actually
On the same day the legislature voted for Map C, the plaintiffs in the lawsuit submitted two alternative maps to the court. Both were designed to actually comply with Proposition 4’s requirements—you know, the thing Utah voters passed to stop exactly this kind of gerrymandering.
Plaintiff Map 1: The Algorithm
The Concept: This map comes from a computer algorithm that generated 10,000 possible maps using Prop 4’s criteria, without considering partisan data. The algorithm just tried to make fair districts. Map 1 is one of those results.
What This Map Does:
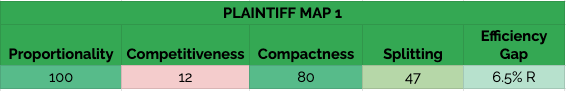
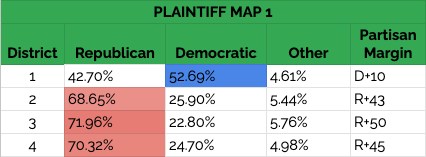
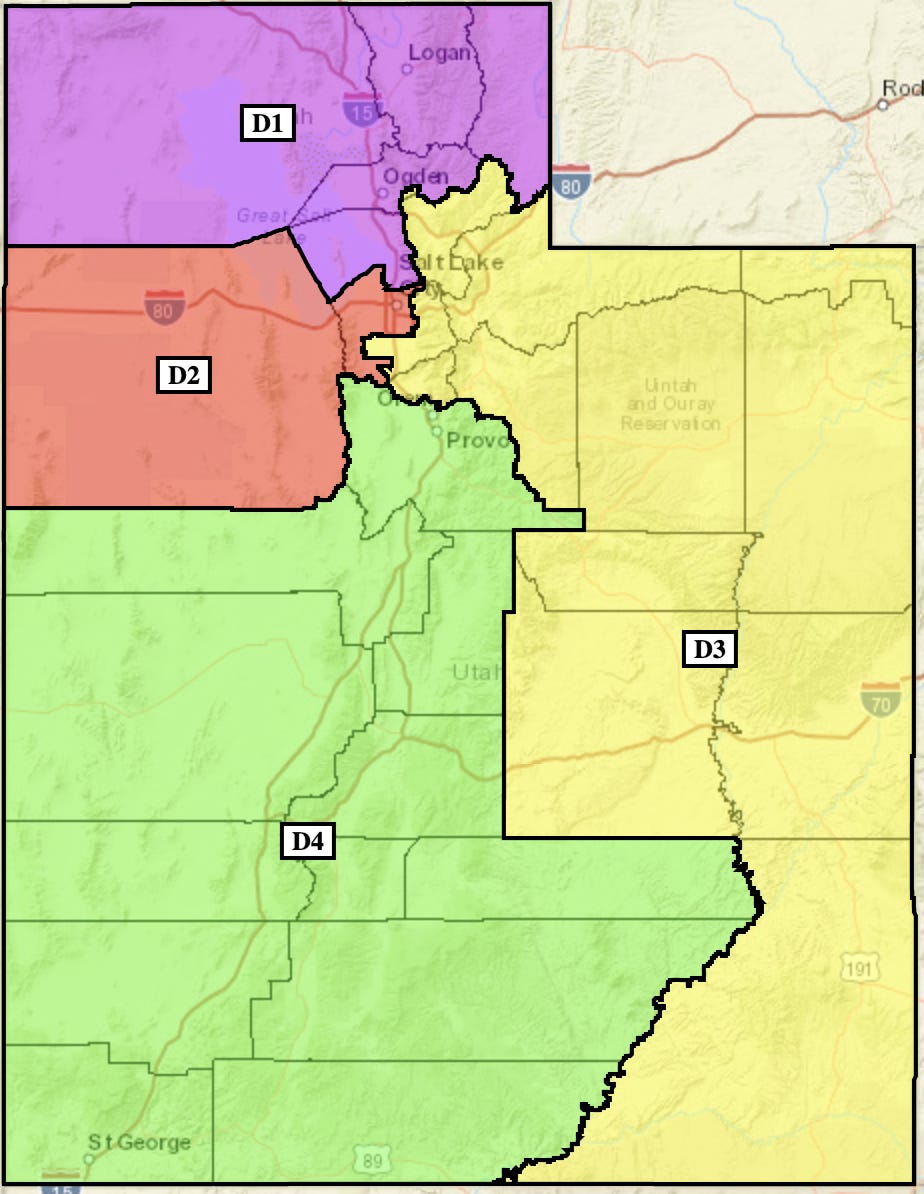
Map 1 creates one clear Democratic district and three Republican districts. That’s a 1-3 split, which actually matches Utah’s statewide voting patterns pretty closely. In a state where Democrats get about 40% of the vote, getting 25% of the seats (1 out of 4) is proportional representation. Hence, the perfect 100/100 proportionality score.
Competitiveness is still low because this map creates safe seats on both sides. District 1 is safely Democratic, and Districts 2-4 are safely Republican.
Not to mention, this map only splits one municipality (Midvale) and is very similar to the Orange and Purple maps from the Independent Redistricting Commission.
Plaintiff Map 2: The “Least Change” Map
The Concept: This one is honestly the funniest possible move. The plaintiffs took the legislature’s Map C and said, “Okay, what if we just... fixed it?”
Map 2 makes minimal changes to the legislature’s adopted map, just enough to actually comply with Prop 4’s requirements and eliminate the partisan favoritism. It’s the “here’s what your map would look like if you cared about fairness” version.
What This Map Does:
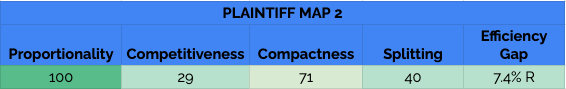
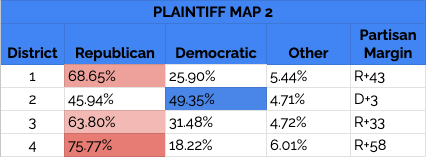
Map 2 achieves the same proportional outcome as Map 1 (one Democratic-leaning district, three Republican districts), but it does something different in District 2: it creates an actually competitive district.
That D+3 lean in District 2 means this is a genuine swing district. Democrats have a slight edge, but Republicans could absolutely win it in a good year. This is the kind of district where campaigns matter, where candidates have to persuade voters, where the outcome isn’t decided before anyone casts a ballot.
The 29/100 competitiveness score is nearly five times better than Map C. That’s not amazing in absolute terms but it’s a massive improvement over Map C.
Map 2 splits only one municipality, compared to Map C’s 3 municipalities carved into 11 pieces. It maintains 84.1% population overlap with the legislature’s enacted map, plus substantial overlap with the independent Commission’s Purple (82.0%) and Orange (77.8%) maps, the ones the legislature ignored.
So it’s the map they already chose, just... less gerrymandered.
Enter Stage Left: Brammer’s Impeachment Threat
The judge now has three maps. The data overwhelmingly favors the plaintiff maps (perfect proportionality scores, dramatically lower efficiency gaps, exponentially better competitiveness). But there’s a problem: the legislature really doesn’t want her to pick them.
The only argument for Map C is the legislature drew it. And according to them, they have the constitutional right to draw maps. (Never mind what the Supreme Court or district court have said.)
But the legislature isn’t going down quietly.
Yesterday, Senator Brammer gave a speech arguing that any court-adopted map would be “malfeasance in office” for both the judge and the Lieutenant Governor.
Brammer claims only the legislature can approve maps, so the court has no power to choose. He says Prop 4 and the state constitution require it.
Except that’s not how this works. Courts remedy constitutional violations constantly. When a legislature passes an unconstitutional map, the court has the power (and obligation) to order a constitutional alternative. Prop 4 prohibits partisan gerrymandering. Map C violates it. The court can pick a compliant map.
The judge won’t—and shouldn’t—be swayed.
The System Working As Designed (For Them)
So what happens now?
The judge rules. The legislature either gets what it wants, or it tries to destroy everyone involved in giving them something else. That’s the actual choice.
This is Utah politics in miniature. Voters pass reforms meant to limit power. The people with power find ways around them or through them, or over them. And when that doesn’t work, they threaten anyone who tries to enforce the reforms. Rinse, repeat.
Redistricting. Medical marijuana. Medicaid expansion. The independent commission that drew maps the legislature threw out. The judge and Lt. Governor who might face impeachment for following it.
See the pattern? Utah has systems meant to check power. Ballot initiatives. Independent commissions. Courts. Constitutional amendments. But those systems only work if the people in power allow them to work. And increasingly, they don’t.
What happens next is what always happens: elected officials who refuse to give up power will use every tool available—threats, manipulation, procedural warfare—to keep it. The only question is whether any institution has the spine to stop them.
Three maps. One designed to preserve power, two designed for fairness. We’ll see which one survives contact with people who have everything to lose.
It's a pity the League of Women Voters didn't also sue over the gerrymandered state representation. Maybe Brammer wouldn't be a surefire re-election after these shenanigans.